How Open-Source Ideas Can Help Us Study Exoplanets
Pluto, the ninth planet in our solar system1 was discovered in 1930, the same year the Institute was founded. While the Institute hosted more than five thousand members in the following sixty-five years, not a single new planet was discovered during the same time.
Finally, in 1995, astronomers spotted an object they called 51 Pegasi b. It was the first discovery of a planet in over half a century. Not only that, it was also the first planet around a Sun-like star outside our own solar system. We now call these planets extrasolar planets, or in short, exoplanets.
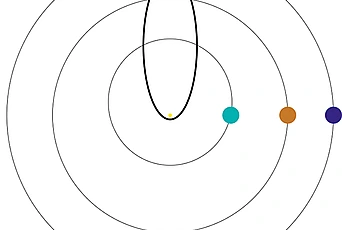
As it turns out, 51 Pegasi b is a pretty weird object. It is almost as massive as Jupiter, but it orbits its host star in only four days. Jupiter, as a comparison, needs twelve years to go around the Sun once. Because 51 Pegasi b is very close to the star, its equilibrium temperature is very high. These types of planets are often referred to as “hot Jupiters.”
Since the first exoplanet was discovered, the technology has improved dramatically, and worldwide efforts by astronomers to detect exoplanets now yield a large number of planet detections each year. In 2011, 189 planets were discovered, approximately the number of visiting Members at the Institute every year. In 2012, 130 new planets were found. As of May 20 of this year, the total number of confirmed exoplanets was 892 in 691 different planetary systems.
Personally, I am very interested in the formation of these systems. We have so much information about every planet in our solar system, but little is known about all of these 892 exoplanets. Digging into this limited data set and trying to find out how exoplanets obtain their present-day orbits is very exciting. Many questions pop up by just looking at 51 Pegasi b. Why is it a hundred times closer to its star than Jupiter? Did it form farther out? Was it not too different from our own Jupiter in the past? For 51 Pegasi b, we think we know the answer. We believe that it formed at a farther distance from its star where conditions such as temperature are more favorable for planet formation, and then it moved inwards in a process called planet migration. For many of the other 891 planets, the story is more complicated, especially when multiple planets are involved. The diversity of planetary systems that have been found is tremendous. We haven’t discovered a single system that looks remotely similar to our own solar system. This makes exoplanetary systems so exciting to study!
To do this kind of research, one needs a catalogue of all exoplanets. Several such databases exist, but they all share one fundamental flaw: they are not “open.” These databases are maintained either by a single person or by a small group of scientists. It is impossible to make contributions to the database if one is not part of this inner circle. This bothered me because it is not the most efficient way, and it does not encourage collaboration among scientists. I therefore started a new project during my time at the Institute, the Open Exoplanet Catalogue. As the name suggests, this database, in comparison to others, is indeed “open.” Everyone is welcome to contribute, make corrections, or add new data. Think of it as the Wikipedia version of an astronomical database.
The same idea has been extremely successful in the software world. With an open-source license, programmers provide anyone with the rights to study, modify, and distribute the software that they have written—for free. The obvious advantages are affordability and transparency. But maybe more importantly, perpetuity, flexibility, and interoperability are vastly improved by making the source code of software publicly available.
The success of the open-source movement is phenomenal. Every time you start a computer, open a web browser, or send an email, you are utilizing an open-source program, often in the background. The success story of open source is largely based on the wide adoption of distributed version-control systems.2 These toolkits allow thousands of people to work and collaborate together on a single project. Every change ever made to any file can be traced back to an individual person. This creates a network of trust, based on human relationships. Initially, the concept of having thousands of people working on the same project may appear chaotic, risky, or plain impossible. However, studies have shown that this kind of large-scale collaboration produces software that is better3 and more secure than using a traditional approach.
Astrophysics lags behind this revolution. While there are some software packages that are open source (and widely used), the idea of applying the same principles to data sets and catalogues is new. Extrasolar planets provide an ideal test case because the data set is generated by many different groups of observers from all around the world. Observations and discoveries are evolving so quickly that a static catalogue is not an option anymore.
To get people excited about the ideas and philosophy behind the Open Exoplanet Catalogue, I started a visualization competition, the “Exoplanet Visualization Contest,” with the goal of coming up with stunning and creative ways to visualize exoplanet data. We set no restrictions to the kind of submission. The only requirement was that each submission had to use real data from the Open Exoplanet Catalogue. This led to an extremely diverse set of submissions. For example, we received publication-grade scientific plots, artistic drawings of potentially habitable exomoons, and an interactive website. One participant went so far as to design a wearable vest with built-in microcontrollers and displays that show exoplanet data. Thanks to a generous outreach grant from the Royal Astronomical Society in London, we were able to give out prizes to the best submissions. With the help of Scott Tremaine (Richard Black Professor in the School), Dave Spiegel (Member in the School), and Dan Fabrycky (Assistant Professor at the University of Chicago), two winners were chosen.
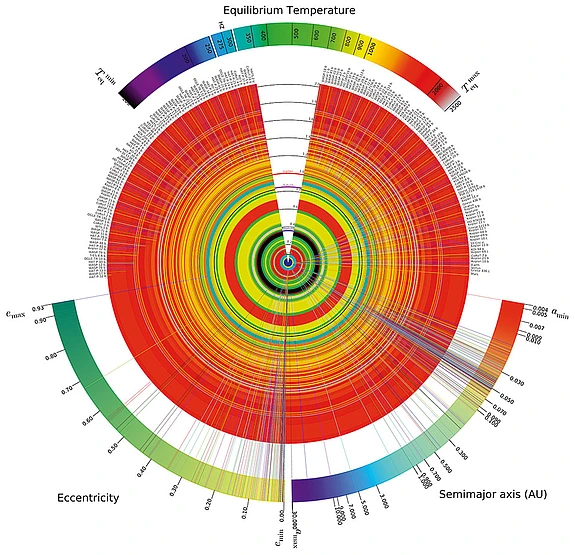
Second prize went to Jorge Zuluaga from Antioquia, Colombia. He designed a new way to present exoplanet data, such as planetary sizes and equilibrium temperatures. Those are of particular interest when it comes to determining whether a planet is potentially habitable or not. His submission, the Comprehensive Exoplanetary Radial Chart, illustrates the radii of exoplanets according to colors that represent their approximate equilibrium temperatures. The chart also shows information on planetary orbit properties, size of host stars, and potentially any other variable of interest.
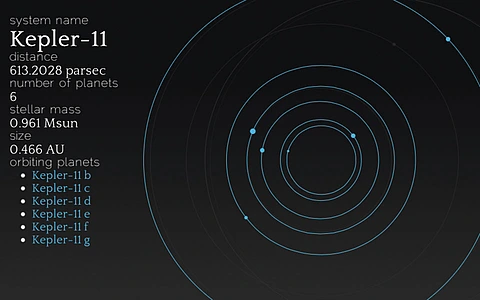
The winner of the contest was Tom Hands, a Ph.D. student from Leicester. He wrote an interactive website, ExoVis, that visualizes all discovered planetary systems. The project makes use of HTML5, Javascript, jQuery, and PHP. One can search for planets, study their orbital parameters, and compare them to other systems, all within a web browser.
The Open Exoplanet Catalogue is a very new project. The crucial issue is to reach a large number of regular contributors; then, the quality of the data set will outperform all “closed” competitors in the long run in the same way Wikipedia is now much more widely used than the Encyclopædia Britannica. I am optimistic about the future.
1 Pluto was originally classified as the ninth planet in the solar system. In 2005, the International Astronomical Union decided to call Pluto a dwarf planet.
2 The most popular of those tools is Git, used by people who write the Linux kernel and many other major open-source projects.
3 In the software world, “better” is measured in units of bugs per line of code.
Recommended Reading: More information about the Open Exoplanet Catalogue, its workflow, and data format is available online at www.openexoplanetcatalogue.com/. Tom Hand’s ExoVis website is hosted at www.tomhands.com/exovis/. High-resolution images of Jorge Zuluaga’s Comprehensive Exoplanetary Radial Chart may be found at http://astronomia.udea.edu.co/iCERC/.