Studying the Shape of Data Using Topology
The story of the “data explosion” is by now a familiar one: throughout science, engineering, commerce, and government, we are collecting and storing data at an ever-increasing rate. We can hardly read the news or turn on a computer without encountering reminders of the ubiquity of big data sets in the many corners of our modern world and the important implications of this for our lives and society.
Our data often encodes extremely valuable information, but is typically large, noisy, and complex, so that extracting useful information from the data can be a real challenge. I am one of several researchers who worked at the Institute this year in a relatively new and still developing branch of statistics called topological data analysis (TDA), which seeks to address aspects of this challenge.
In the last fifteen years, there has been a surge of interest and activity in TDA, yielding not only practical new tools for studying data, but also some pleasant mathematical surprises. There have been applications of TDA to several areas of science and engineering, including oncology, astronomy, neuroscience, image processing, and biophysics.
The basic goal of TDA is to apply topology, one of the major branches of mathematics, to develop tools for studying geometric features of data. In what follows, I’ll make clear what we mean by “geometric features of data,” explain what topology is, and discuss how we use topology to study geometric features of data. To finish, I’ll describe one application of TDA to oncology, where insight into the geometric features of data offered by TDA led researchers to the discovery of a new subtype of breast cancer.
In this article, by “data” I simply mean a finite set of points in space. In general, the space in which our points lie can have many dimensions, but for now the reader may think of the points as sitting in two or three dimensions. For a concrete example, each point in adata set in 3-D space might correspond to a tumor in a cancer study, and the x, y, and z coordinates of the point might each correspond to the level of expression of a different gene in a tissue sample of the tumor.
What, then, do I mean by “geometric features of data?” Rather than offer a formal definition, I’ll give three representative examples of the sorts of geometric features of data we study in TDA. I’ll take the data in each of the examples to lie in 2-D space.
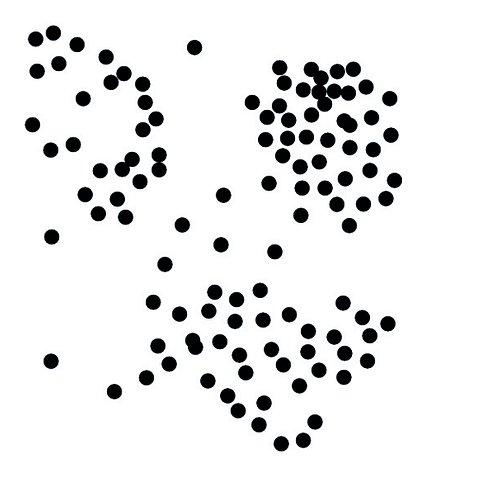
As a first example, consider the data set in Figure 1. We see that the data breaks up into three distinct clusters. Clusters like these are a first type of geometric feature of data we study in TDA. We’d like to count the number of distinct clusters in the data and partition the data into its clusters. We’d like to be able to do this even when the cluster structure of the data is corrupted by noise, as in Figure 2.
The problem of detecting clusters in data is in fact an old and well-studied problem in statistics and computer science, but TDA has recently introduced some new ideas and tools to the problem.1
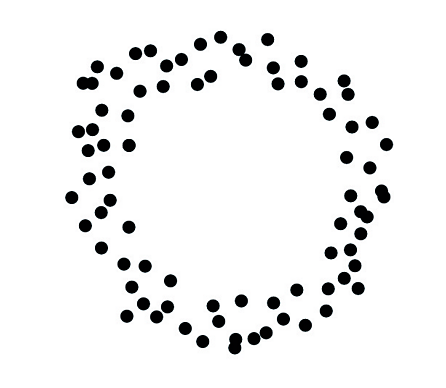
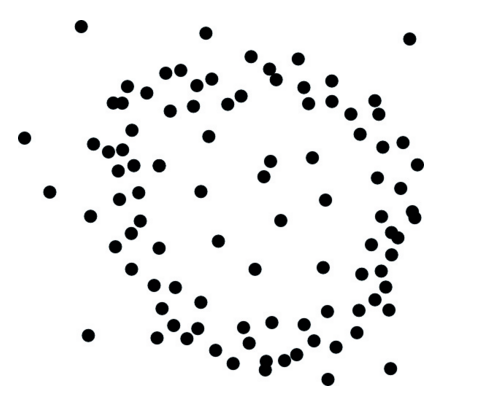
A second kind of geometric feature of data we study in topological data analysis is a “loop.” Figure 3 gives an example of a loop in a data set. Again, we’d like to be able to detect a loop in a data set even when it is
corrupted by noise, as in Figure 4.
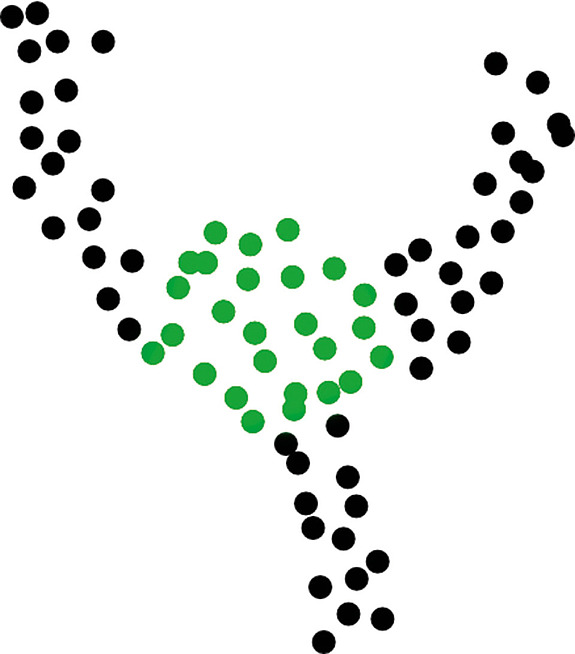
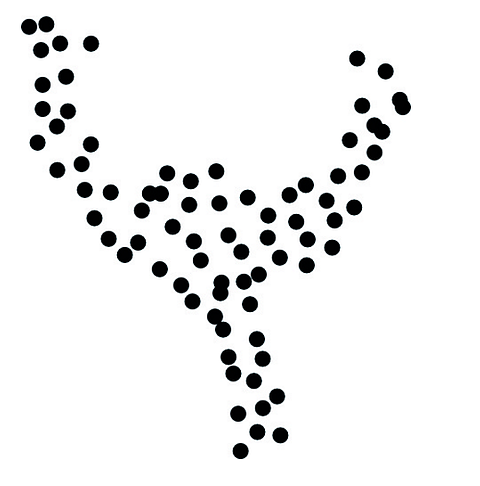
A third kind of geometric feature we study in TDA is a “tendril.” Figure 5 depicts a data set with three tendrils emanating from a central core. In a data set with this sort of structure, we’d like to detect the presence of the tendrils, count the tendrils, and partition the data into its different tendrils.
The objective of research in TDA is to develop tools to detect and visualize these kinds of geometric features, and to develop methodology for quantifying the statistical significance of such features in randomly sampled data. Because much of the data arising in scientific applications lives in high-dimensional spaces, the focus is on developing tools suitable for studying geometric features in high-dimensional data.
Why, though, should we be interested in studying such features of data in the first place? The key premise behind this line of research is that insight into the shape of scientifically relevant data has a good chance of giving insight into the science itself.
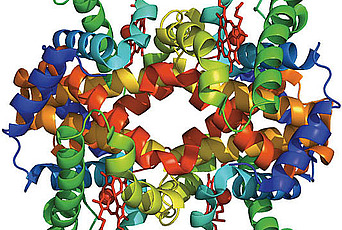
Experience has shown that this premise is a reasonable one. Cluster analysis is used as a matter of course throughout the experimental sciences to extract scientific information from data;2 the study of loops and their higher-dimensional analogues has recently offered insight into questions in biophysics3 and natural-scene statistics;4 and, as I will describe in the last section of this article, the study of tendrils has recently offered insight into oncology.5
As noted above, TDA studies the geometric features of data using topology. Topology is the study of the properties of a geometric object that are preserved when we bend, twist, stretch, and otherwise deform the object without tearing it. The primary example of such a property is the presence of holes in the object; as such, topology is concerned largely with the formal study of holes. (Homotopy theory, discussed in the article about the Institute’s univalent foundations program on page 1, is a central part of topology. However, homotopy theory also admits an axiomatic formulation that abstracts away from the topological setting and provides a framework for the adaption of topological ideas to settings outside of topology.)
To anyone who’s ever eaten a slice of swiss cheese or a doughnut, the notion of a hole in a geometric object is a familiar and intuitive one; the idea that the number of holes in a geometric object doesn’t change when we bend, twist, and stretch the object is similarly intuitive.
In topology, we distinguish between several different kinds of holes. A hole at the center of a donut is an example of a first kind of hole; the hollow space inside an inflated, tied ballon is an example of a second kind of hole. In geometric objects in more than three dimensions, we may also encounter other kinds of holes that cannot appear in objects in our three-dimensional world.
As intuitive as the notion of a hole is, there is quite a lot to say about holes, mathematically speaking. In the last century, topologists have put great effort into the study of holes, and have developed a rich theory with fundamental connections to most other areas of modern mathematics. One feature of this theory is a well-developed set of formal tools for computing the number of holes of different kinds in a geometric object. TDA aims to put this set of tools to use in the study of data. Computations of the number of holes in a geometric object can be done automatically on a computer, even when the object lives in a high-dimensional space and cannot be visualized directly.
Besides the number of holes in an object, another (very simple) property of a geometric object that is preserved under bending, twisting, and stretching is the number of components (i.e. separate pieces) making up the object. For example, a plus sign + is made up of one component, an equals sign = is made up of two components, and a division sign ÷ is made up of three components. Deforming any of these symbols without tearing does not change the number of components in the symbol. We regard the problem of computing the number of components that make up a geometric object as part of topology. In fact, in a formal sense, this problem turns out to be closely related to the problem of computing the number of holes in a geometric object, and topologists think of these two problems as two sides of the same coin.
How do we use topology to study the geometric features of data? Without pretending to give a full answer to this question, I’ll mention some of the basic ideas. To begin, I’ll describe a primitive strategy for studying data using topology that, while unsatisfactory for most applications, is the starting point for what is done in practice.
As mentioned above, topology offers tools for computing numbers of holes and components in a geometric object; we would like to apply these tools to our study of data. However, a data set X of n points in space has n components and no holes at all, so directly computing the numbers of holes and components of X will not tell us anything interesting about the geometric features of X.
To study X using topology then, we will consider not the topological properties of X directly, but rather the topological properties of a “thickening” of X.
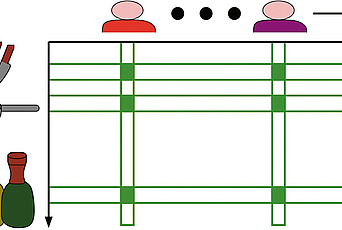
I’ll explain this in detail. Assume that X is a finite set of points in the plane (2-D space). Let δ be a positive number, and let T(X, δ) be the set of all points in the plane within distance δ from some point in X; we think of T(X, δ) as a “thickening” of the data set X.
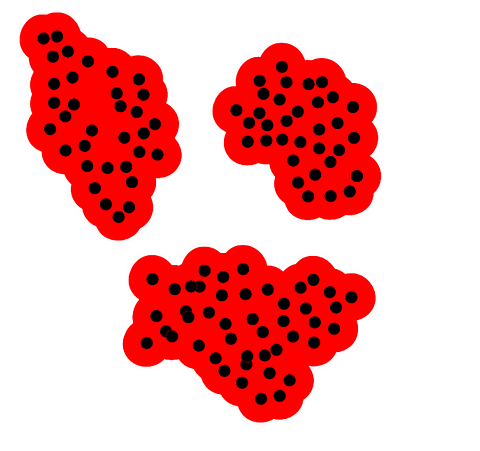
For example, let X1 be the data set of Figure 1. Figure 6 shows T(X1, δ1) in red for some choice of positive number δ1, together with the original data X1 in black. For a second example, let X2 be the data set of Figure 3. Figure 7 shows T(X2, δ2) in red, for some choice of positive number δ2, together with X2 in black. For especially nice data sets X and good choices of δ, the clusters in X will correspond to components of T(X, δ) and the loops in X will correspond to holes in T(X, δ). For instance, in Figure 6 the clusters in X1 correspond to the components of T(X1, δ1), and in Figure 7 the loop in X2 corresponds to the hole in T(X2, δ2).

Thus, for nice data sets X, we can get insight into the geometric features of X by studying the topological properties of T(X, δ). The same strategy also works for studying the geometric features of a data set sitting in a high-dimensional space, in which case the data cannot be visualized directly.
Most data sets we encounter in practice are not as nice as those of Figures 1 and 3, and though the primitive TDA strategy we have described does extend to data in high-dimensional spaces, for typical data sets X in any dimension, the strategy has several critical shortcomings. For one, the topological properties of T(X, δ) can depend in a very sensitive way on the choice of δ, and a priori it is not clear what the correct choice of δ should be, or if a correct choice of δ exists at all, in any sense. Also, the topological properties of T(X, δ) are not at all robust to noise in X, so that this strategy will not work for studying the geometric features of noisy data sets, such as those in Figures 2 and 4. Moreover, this approach to TDA is not good at distinguishing small geometric features in the data from large ones.
Thus, for dealing with most data one encounters in practice, more sophisticated variants of this basic strategy are required. Much of the recent research in TDA has been focused on developing such variants. One central idea in this direction is that it is much better to consider at once the topological properties of the entire family of objects T(X, δ) as δ varies than it is to consider the topological properties of T(X, δ) for a single choice of δ. This is the idea behind persistent homology, a key technical tool in TDA.
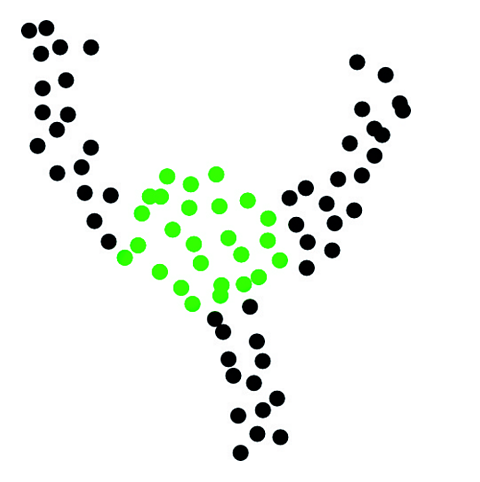
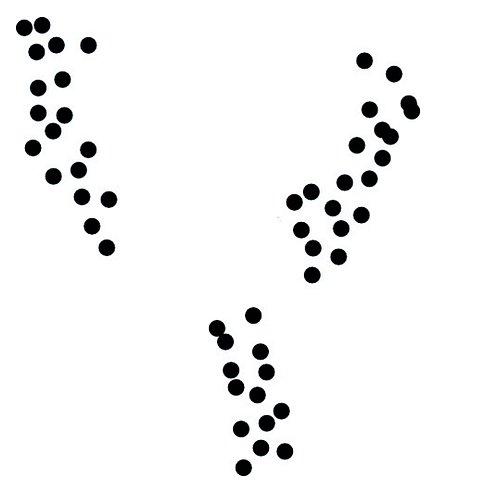
The problem of studying tendrils in data is closely related to the problem of studying clusters. To see this, consider Figure 8, where the points in the central core of the data in Figure 5 are shown in green.
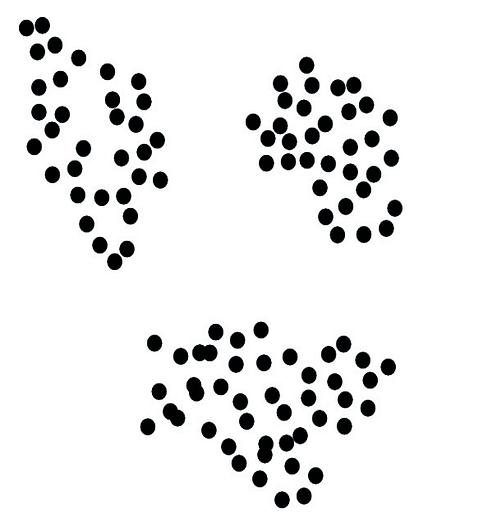
If we were to have a principled way of identifying the central core of the data, then by removing that central core, we would obtain a data set with three distinct clusters, as in Figure 9, where each cluster corresponds to a tendril in the original data set. It is natural to expect, then, that some of the topological tools that are useful for studying clusters can be extended to the study5 of tendrils, and in fact this is the case.
In work published in 2011 by Monica Nicolau, Gunnar Carlsson, and Arnold Levine (Professor Emeritus in the School of Natural Sciences),5 insight offered by TDA into the geometric features of data led the authors to the discovery of a new subtype of breast cancer.
The authors studied a data set describing the gene expression profiles of 295 breast cancer tumors, each from a unique patient. The data set consists of 295 points sitting in a 24,479-dimensional space: each point corresponds to one tumor and, roughly speaking, each of the 24,479 coordinates of the point specifies the level of expression of one gene in a tissue sample of the corresponding tumor.
To begin their analysis of the data, the researchers mapped the data from the 24,479-dimensional space into a 262-dimensional space in a way that preserved aspects of the geometric structure of the data relevant to cancer, while eliminating aspects of that structure not relevant to cancer.
The researchers then studied the geometric features of the data in 262-dimensional space using a TDA tool called Mapper.6 They discovered a three-tendril structure in the data loosely analogous to that in the data of Figure 5. In addition, they found that one of these tendrils decomposes further, in a sense, into three clusters. One of these three clusters, they observed, corresponds to a distinct subtype of breast cancer tumor that had hitherto not been identified. This subtype, which the authors named c-MYB+, comprises 7.5 percent of the data set (22 tumors). Tumors belonging to the c-MYB+ subtype are genetically quite different than normal tissue, yet patients whose tumors belonged to this subtype had excellent outcomes: their cancers never metastasized, and their survival rate was 100 percent.
A standard approach to the classification of breast cancers, based on clustering, divides breast cancers into five groups. The c-MYB+ subtype does not fit neatly into this classification scheme: the c-MYB+ tumors divide among three of the five groups. The results of Nicolau, Carlsson, and Levine thus suggest a nuance to the taxonomy of breast cancer not accounted for in the standard classification model.
These results illustrate how the tools of TDA can be useful in helping researchers tease out some of the scientific information encoded in their high-dimensional data. They are just one of a growing number of examples where TDA has facilitated the discovery of interesting scientific information from data. Still, in spite of good progress in the field over the last several years, there’s still much to be done in terms of fleshing out the mathematical and statistical foundations of TDA, and in terms of algorithm and software development. The shared hope among researchers in the field is that by advancing the theory and tools of TDA, we can lay the groundwork for the discovery of new applications of TDA to the sciences.
For further details about TDA, see any of the several surveys available on TDA,7-9 or the book.10
1 Frédéric Chazal, Leonidas J. Guibas, Steve Y. Oudot, and Primoz Skraba, “Persistence-Based Clustering in Riemannian Manifolds,” in Proceedings of the Twenty-Seventh Annual ACM Symposium on Computational Geometry (Association for Computing Machinery, 2011), 97–106.
2 Anil K. Jain, M. Narasimha Murty, and Patrick J. Flynn, “Data Clustering: A Review,” ACM Computing Surveys (CSUR) 31, no. 3 (1999): 264–323.
3 Marcio Gameiro, Yasuaki Hiraoka, Shunsuke Izumi, Miroslav
Kramar, Konstantin Mischaikow, and Vidit Nanda, “Topological Measurement of Protein Compressibility via Persistence Diagrams,” MI Preprint Series 2012-6, Faculty of Mathematics, Kyushu University, 2012.
4 Gunnar Carlsson, Tigran Ishkhanov, Vin De Silva, and Afra Zomorodian, “On the Local Behavior of Spaces of Natural Images,” International Journal of Computer Vision 76, no. 1 (2008): 1–12.
5 Monica Nicolau, Arnold J. Levine, and Gunnar Carlsson, “Topology-Based Data Analysis Identifies a Subgroup of Breast Cancers with a Unique Mutational Profile and Excellent Survival,” Proceedings of the National Academy of Sciences 108, no. 17 (2011): 7265–70.
6 Gurjeet Singh, Facundo Mémoli, and Gunnar Carlsson, “Topological Methods for the Analysis of High-Dimensional Data Sets and 3-D Object Recognition,” in Eurographics Association Symposium on Point-Based Graphics 22 (The Eurographics Association, 2007).
7 Gunnar Carlsson, “Topology and Data,” Bulletin of the American Mathematical Society 46, no. 2 (2009): 255–308.
8 Herbert Edelsbrunner and John L. Harer, “Persistent Homology: A Survey,” in Surveys on Discrete and Computational Geometry: Twenty Years Later: AMS-IMS-SIAM Joint Summer Research Conference, June 18–22, 2006, Snowbird, Utah 453 (American Mathematical Society, 2008), 257.
9 Robert Ghrist, “Barcodes: The Persistent Topology of Data,” Bulletin of the American Mathematical Society 45, no. 1 (2008): 61.
10 Herbert Edelsbrunner and John L. Harer, Computational Topology: An Introduction (American Mathematical Society, 2010).